This is the multi-page printable view of this section. Click here to print.

Return to the regular view of this page.

Overview

Overview of the Logging Operator

Logging Operator is an operator created in Golang to set up and manage EFK(Elasticsearch, Fluentd, and Kibana) cluster inside Kubernetes and Openshift environment. This operator is capable of setting up each individual component of EFK cluster separately.

Architecture

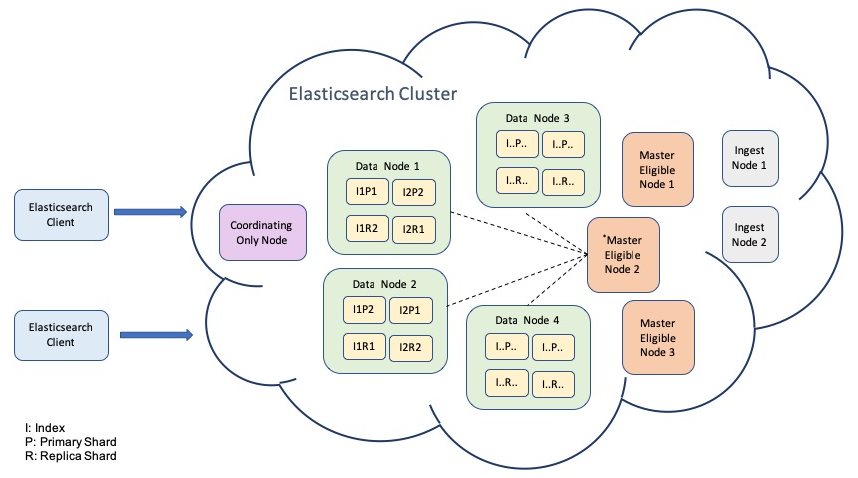
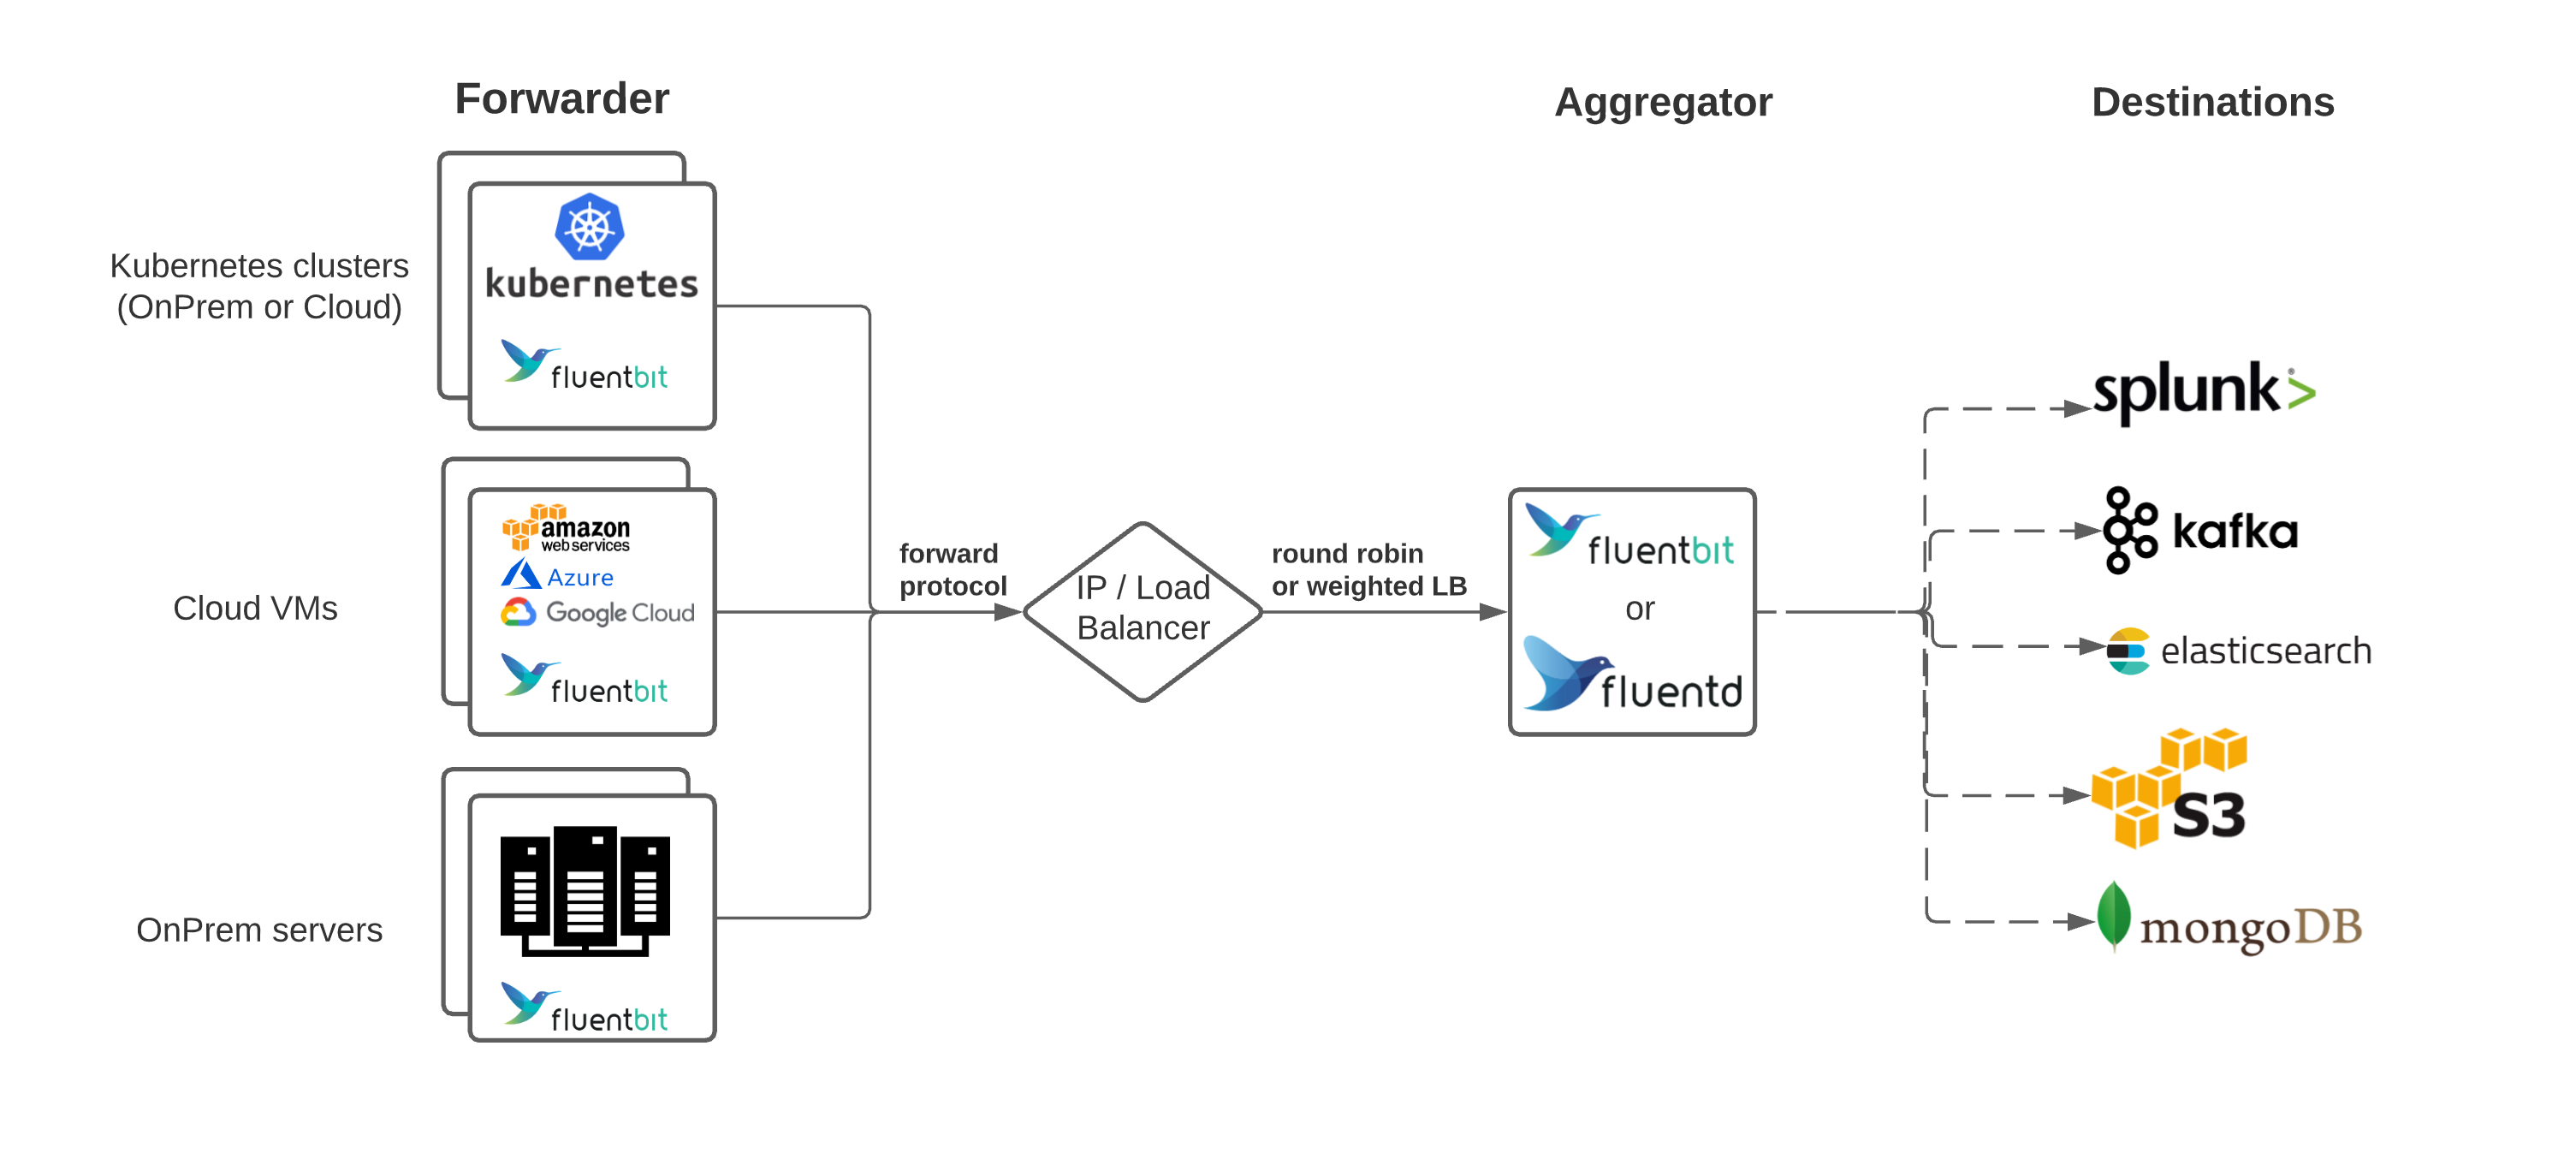
Architecture for Logging operator looks like this:-

Purpose

The aim and purpose of creating this Logging Operator to provide an easy and extensible interface to setting up logging stack such as EFK(Elasticsearch, Fluentd, and Kibana). It helps in setting up different nodes of elasticsearch cluster, fluentd as a log shipper and kibana for visualization.

Supported Features

  • Setup of elasticsearch cluster with different nodes type:- master, data, ingestion, and client.
  • Customizable configuration for elasticsearch, fluentd stack.
  • Setup of fluentd as light-weight log-shipper as Daemonset.
  • Kibana will be set up as visualization tool for elastic stack.
  • Seamless upgrades of elasticsearch, fluentd, and kibana.
  • Security best practices support for complete stack such as TLS, elastic security.
  • Kubernetes resources objects support like:- resources, securityContext, affinity, tolerations, etc.

1 - Elasticsearch

An overview of Elasticsearch database/search-engine, types of setup and architecture design

Elasticsearch is a distributed open-source search and analytics engine built on Java and Apache Lucene. It allows us to store, search and analyze huge chunk of data with nearly real time and high performance. It is a REST API based system on which we can easily write and query the data, in easy words we can say that Elasticsearch is a server that can process JSON requests and returns JSON response.

There are different use cases for elasticsearch like:-

  • NoSQL database
  • Logs storage and searching
  • Real time and time series analysis

Features

  • Scalability: It is scalable across multiple nodes. This means we can start with less number of nodes and in case our workload increases then we can scale across multiple nodes. It is easily scalable.
  • Fast: It is really fast in terms of performance when compared to other search engines that are available.
  • Multilingual: It supports various languages.
  • Document Oriented: Instead of schemas and tables, the data is stored in documents. All the data is stored in JSON format. JSON is the widely accepted web format due to which we can easily integrate the generated output in other applications if required.
  • Auto-completion: It returns documents that contain a specific prefix in a provided field.

Elasticsearch Architecture

2 - Fluentd

A detailed guide for designing the setup of Fluentd architecture

Fluentd is an open source data collector, which lets you unify the data collection and consumption for a better use and understanding of data. Fluentd tries to structure data as JSON as much as possible: this allows Fluentd to unify all facets of processing log data: collecting, filtering, buffering, and outputting logs across multiple sources and destinations.

Features

  • JSON Logging: Fluentd tries to structure data as JSON as much as possible: this allows Fluentd to unify all facets of processing log data: collecting, filtering, buffering, and outputting logs across multiple sources and destinations.
  • Pluggable Architecture: Fluentd has a flexible plugin system that allows the community to extend its functionality. Our 500+ community-contributed plugins connect dozens of data sources and data outputs.
  • Minimum Resources Required: Fluentd is written in a combination of C language and Ruby, and requires very little system resource. The vanilla instance runs on 30-40MB of memory and can process 13,000 events/second/core.
  • Built-in Reliability: Fluentd supports memory- and file-based buffering to prevent inter-node data loss. Fluentd also supports robust failover and can be set up for high availability.

Architecture

3 - Kibana

A detailed guide for Kibana setup and management

Kibana is a free and open frontend application that sits on top of the Elastic Stack, providing search and data visualization capabilities for data indexed in Elasticsearch. Commonly known as the charting tool for the Elastic Stack. The core feature of Kibana is data querying & analysis. In addition, Kibana’s visualization features allow you to visualize data in alternate ways using heat maps, line graphs, histograms, pie charts, and geospatial support. With various methods, you can search the data stored in Elasticsearch for root cause diagnostics.

Features

  • Visualization: Kibana has a lot of ways to visualize data in an easy way. Some of the ones which are commonly used are vertical bar chart, horizontal bar chart, pie chart, line graph, heat map etc.
  • Dashboard: When we have the visualizations ready, all of them can be placed on one board – the Dashboard. Observing different sections together gives you a clear overall idea about what exactly is happening.
  • Dev Tools: You can work with your indexes using dev tools. Beginners can add dummy indexes from dev tools and also add, update, delete the data and use the indexes to create visualization.
  • Reports: All the data in the form of visualization and dashboard can be converted to reports (CSV format), embedded in the code or in the form of URLs to be shared with others.
  • Filters and Search query: You can make use of filters and search queries to get the required details for a particular input from a dashboard or visualization tool.

Architecture