All the Logging Operator documentation and examples.
This is the multi-page printable view of this section. Click here to print.
Documentation
- 1: Overview
- 1.1: Elasticsearch
- 1.2: Fluentd
- 1.3: Kibana
- 2: Getting Started
- 2.1: Installation
- 2.2: Elasticsearch Setup
- 2.3: Fluentd Setup
- 2.4: Kibana Setup
- 3: Configuration
- 3.1: Elasticsearch Config
- 3.2: Fluentd Config
- 3.3: Kibana Config
- 4: Advance Configuration
- 4.1: Elasticsearch
- 4.1.1: Plugins Management
- 4.1.2: Keystore Integration
- 5: Development
- 6: Release History
- 6.1: CHANGELOG
1 - Overview
Overview of the Logging Operator
Logging Operator is an operator created in Golang to set up and manage EFK(Elasticsearch, Fluentd, and Kibana) cluster inside Kubernetes and Openshift environment. This operator is capable of setting up each individual component of EFK cluster separately.
Architecture
Architecture for Logging operator looks like this:-

Purpose
The aim and purpose of creating this Logging Operator to provide an easy and extensible interface to setting up logging stack such as EFK(Elasticsearch, Fluentd, and Kibana). It helps in setting up different nodes of elasticsearch cluster, fluentd as a log shipper and kibana for visualization.
Supported Features
- Setup of elasticsearch cluster with different nodes type:- master, data, ingestion, and client.
- Customizable configuration for elasticsearch, fluentd stack.
- Setup of fluentd as light-weight log-shipper as Daemonset.
- Kibana will be set up as visualization tool for elastic stack.
- Seamless upgrades of elasticsearch, fluentd, and kibana.
- Security best practices support for complete stack such as TLS, elastic security.
- Kubernetes resources objects support like:- resources, securityContext, affinity, tolerations, etc.
1.1 - Elasticsearch
An overview of Elasticsearch database/search-engine, types of setup and architecture design
Elasticsearch is a distributed open-source search and analytics engine built on Java and Apache Lucene. It allows us to store, search and analyze huge chunk of data with nearly real time and high performance. It is a REST API based system on which we can easily write and query the data, in easy words we can say that Elasticsearch is a server that can process JSON requests and returns JSON response.
There are different use cases for elasticsearch like:-
- NoSQL database
- Logs storage and searching
- Real time and time series analysis

Features
- Scalability: It is scalable across multiple nodes. This means we can start with less number of nodes and in case our workload increases then we can scale across multiple nodes. It is easily scalable.
- Fast: It is really fast in terms of performance when compared to other search engines that are available.
- Multilingual: It supports various languages.
- Document Oriented: Instead of schemas and tables, the data is stored in documents. All the data is stored in JSON format. JSON is the widely accepted web format due to which we can easily integrate the generated output in other applications if required.
- Auto-completion: It returns documents that contain a specific prefix in a provided field.
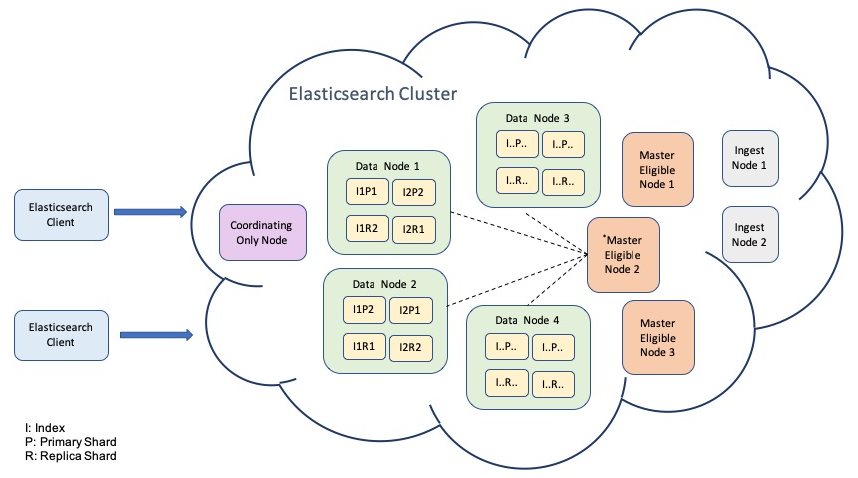
Elasticsearch Architecture
1.2 - Fluentd
A detailed guide for designing the setup of Fluentd architecture
Fluentd is an open source data collector, which lets you unify the data collection and consumption for a better use and understanding of data. Fluentd tries to structure data as JSON as much as possible: this allows Fluentd to unify all facets of processing log data: collecting, filtering, buffering, and outputting logs across multiple sources and destinations.

Features
- JSON Logging: Fluentd tries to structure data as JSON as much as possible: this allows Fluentd to unify all facets of processing log data: collecting, filtering, buffering, and outputting logs across multiple sources and destinations.
- Pluggable Architecture: Fluentd has a flexible plugin system that allows the community to extend its functionality. Our 500+ community-contributed plugins connect dozens of data sources and data outputs.
- Minimum Resources Required: Fluentd is written in a combination of C language and Ruby, and requires very little system resource. The vanilla instance runs on 30-40MB of memory and can process 13,000 events/second/core.
- Built-in Reliability: Fluentd supports memory- and file-based buffering to prevent inter-node data loss. Fluentd also supports robust failover and can be set up for high availability.
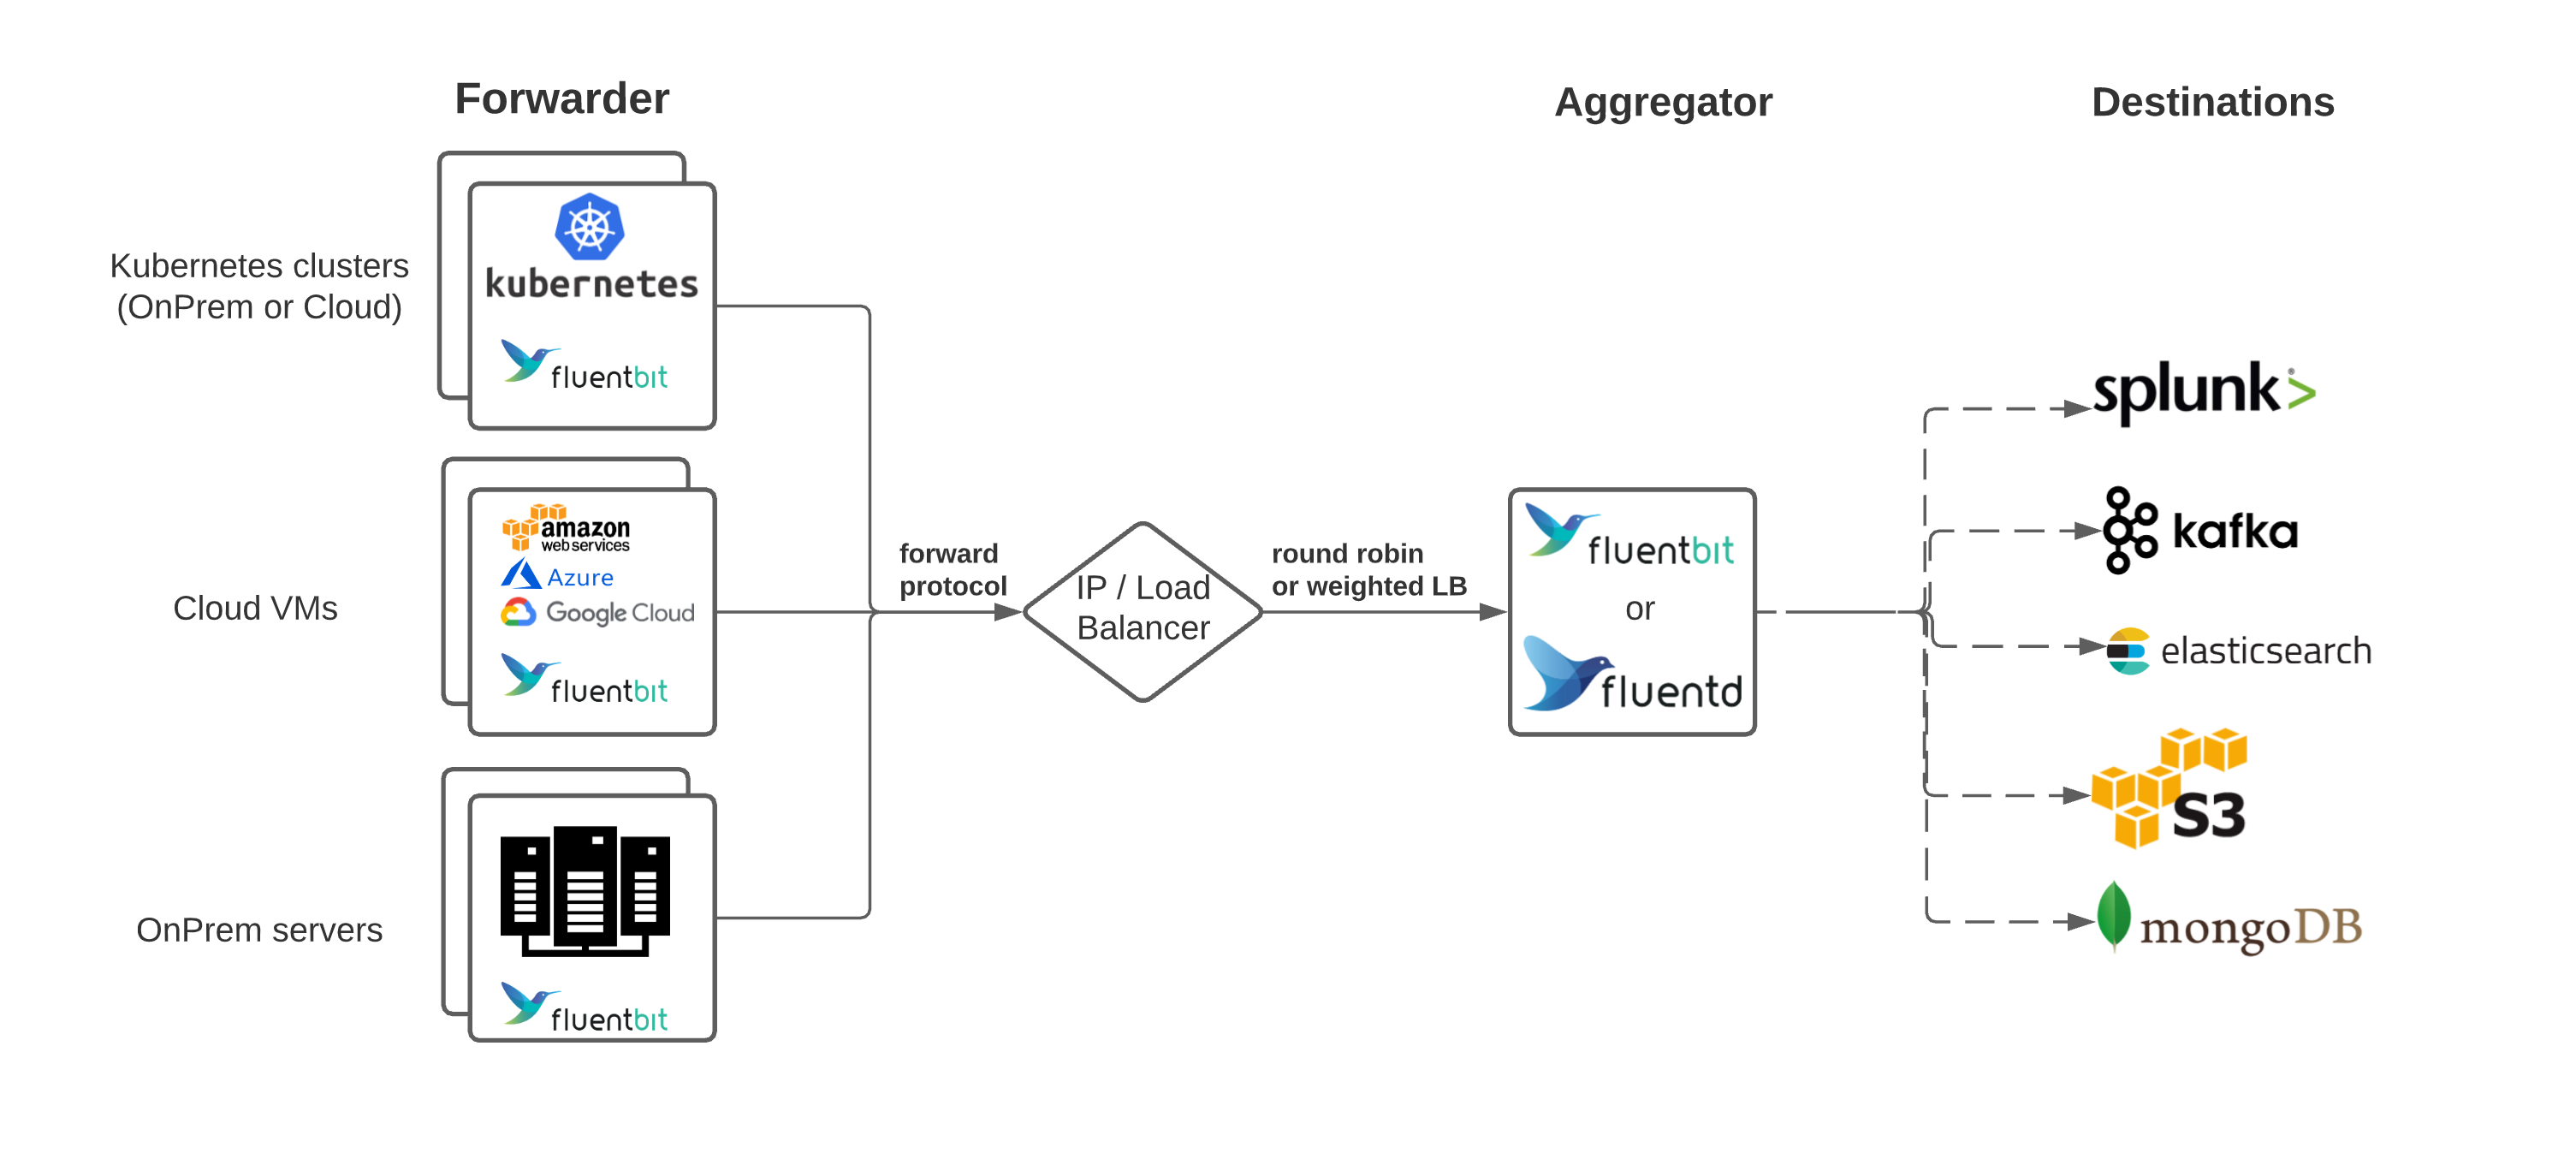
Architecture
1.3 - Kibana
A detailed guide for Kibana setup and management
Kibana is a free and open frontend application that sits on top of the Elastic Stack, providing search and data visualization capabilities for data indexed in Elasticsearch. Commonly known as the charting tool for the Elastic Stack. The core feature of Kibana is data querying & analysis. In addition, Kibana’s visualization features allow you to visualize data in alternate ways using heat maps, line graphs, histograms, pie charts, and geospatial support. With various methods, you can search the data stored in Elasticsearch for root cause diagnostics.

Features
- Visualization: Kibana has a lot of ways to visualize data in an easy way. Some of the ones which are commonly used are vertical bar chart, horizontal bar chart, pie chart, line graph, heat map etc.
- Dashboard: When we have the visualizations ready, all of them can be placed on one board – the Dashboard. Observing different sections together gives you a clear overall idea about what exactly is happening.
- Dev Tools: You can work with your indexes using dev tools. Beginners can add dummy indexes from dev tools and also add, update, delete the data and use the indexes to create visualization.
- Reports: All the data in the form of visualization and dashboard can be converted to reports (CSV format), embedded in the code or in the form of URLs to be shared with others.
- Filters and Search query: You can make use of filters and search queries to get the required details for a particular input from a dashboard or visualization tool.
Architecture

2 - Getting Started
For guide to install, setup and manage Logging Operator
2.1 - Installation
Logging Operator installation, upgrade guide
Logging operator is based on the CRD framework of Kubernetes, for more information about the CRD framework please refer to the official documentation. In a nutshell, CRD is a feature through which we can develop our own custom API’s inside Kubernetes.
The API versions for Logging Operator available are:-
- ElasticSearch
- Fluentd
- Kibana
Logging Operator requires a Kubernetes cluster of version >=1.16.0. If you have just started with the CRD and Operators, its highly recommended using the latest version of Kubernetes.
Setup of Logging operator can be easily done by using simple helm and kubectl commands.
Note
The recommded of way of installation is helm.Setup using Helm tool
The setup can be done by using helm. The logging-operator can easily get installed using helm commands.
# Add the helm chart
$ helm repo add ot-helm https://ot-container-kit.github.io/helm-charts/
...
"ot-helm" has been added to your repositories
# Deploy the Logging Operator
$ helm upgrade logging-operator ot-helm/logging-operator \
  --install --namespace ot-operators
...
Release "logging-operator" does not exist. Installing it now.
NAME:          logging-operator
LAST DEPLOYED: Sun May 29 01:06:58 2022
NAMESPACE:     ot-operators
STATUS:        deployed
REVISION:      1
After the deployment, verify the installation of operator.
# Testing Operator
$ helm test logging-operator --namespace ot-operators
...
NAME:           logging-operator
LAST DEPLOYED:  Sun May 29 01:06:58 2022
NAMESPACE:      ot-operators
STATUS:         deployed
REVISION:       1
TEST SUITE:     logging-operator-test-connection
Last Started:   Sun May 29 01:07:56 2022
Last Completed: Sun May 29 01:08:02 2022
Phase:          Succeeded
Verify the deployment of Logging Operator using kubectl command.
# List the pod and status of logging-operator
$ kubectl get pods -n ot-operators -l name=logging-operator
...
NAME                               READY   STATUS    RESTARTS   AGE
logging-operator-fc88b45b5-8rmtj   1/1     Running   0          21d
Setup using Kubectl
In any case using helm chart is not a possiblity, the Logging operator can be installed by kubectl commands as well.
As a first step, we need to set up a namespace and then deploy the CRD definitions inside Kubernetes.
# Setup of CRDS
$ kubectl apply -f https://raw.githubusercontent.com/OT-CONTAINER-KIT/logging-operator/master/config/crd/bases/logging.logging.opstreelabs.in_elasticsearches.yaml
$ kubectl apply -f https://raw.githubusercontent.com/OT-CONTAINER-KIT/logging-operator/master/config/crd/bases/logging.logging.opstreelabs.in_fluentds.yaml
$ kubectl apply -f https://raw.githubusercontent.com/OT-CONTAINER-KIT/logging-operator/master/config/crd/bases/logging.logging.opstreelabs.in_kibanas.yaml
$ kubectl apply -f https://github.com/OT-CONTAINER-KIT/logging-operator/raw/master/config/crd/bases/logging.logging.opstreelabs.in_indextemplates.yaml
$ kubectl apply -f https://github.com/OT-CONTAINER-KIT/logging-operator/raw/master/config/crd/bases/logging.logging.opstreelabs.in_indexlifecycles.yaml
Once we have namespace in the place, we need to set up the RBAC related stuff like:- ClusterRoleBindings, ClusterRole, Serviceaccount.
# Setup of RBAC account
$ kubectl apply -f https://raw.githubusercontent.com/OT-CONTAINER-KIT/logging-operator/main/config/rbac/service_account.yaml
$ kubectl apply -f https://raw.githubusercontent.com/OT-CONTAINER-KIT/logging-operator/main/config/rbac/role.yaml
$ kubectl apply -f https://github.com/OT-CONTAINER-KIT/logging-operator/blob/main/config/rbac/role_binding.yaml
As last part of the setup, now we can deploy the Logging Operator as deployment of Kubernetes.
# Deployment for MongoDB Operator
$ kubectl apply -f https://github.com/OT-CONTAINER-KIT/logging-operator/raw/main/config/manager/manager.yaml
Verify the deployment of Logging Operator using kubectl command.
# List the pod and status of logging-operator
$ kubectl get pods -n ot-operators -l name=logging-operator
...
NAME                               READY   STATUS    RESTARTS   AGE
logging-operator-fc88b45b5-8rmtj   1/1     Running   0          21d
2.2 - Elasticsearch Setup
Elasticsearch setup and management using logging operator
The operator is capable for setting up elasticsearch cluster with all the best practices in terms of security, performance and reliability.
There are different elasticsearch nodes supported by this operator:-
- Master Node: A node that has the master role (default), which makes it eligible to be elected as the master node, which controls the cluster.
- Data Node: A node that has the data role (default). Data nodes hold data and perform data related operations such as CRUD, search, and aggregations.
- Ingestion Node: A node that has ingest role (default). Ingest nodes are able to apply an ingest pipeline to a document in order to transform and enrich the document before indexing. With a heavy ingest load, it makes sense to use dedicated ingest nodes and to not include ingest role from nodes that have the master or data roles.
- Client or Coordinator Node: Requests like search requests or bulk-indexing requests may involve data held on different data nodes. A search request, for example, is executed in two phases which are coordinated by the node which receives the client request the coordinating node.
There are few additional functionalities supported in the elasticsearch CRD.
- TLS support and xpack support
- Multi node cluster setup - master, data, ingestion, client
- Custom configuration for each type of elasticsearch node

Setup using Helm (Deployment Tool)
Add the helm repository, so that Elasticsearch chart can be available for the installation. The repository can be added by:-
# Adding helm repository
$ helm repo add ot-helm https://ot-container-kit.github.io/helm-charts/
...
"ot-helm" has been added to your repositories
If the repository is added make sure you have updated it with the latest information.
# Updating ot-helm repository
$ helm repo update
Once all these things have completed, we can install Elasticsearch cluster by using:-
# Install the helm chart of Elasticsearch
$ helm install elasticsearch ot-helm/elasticsearch --namespace ot-operators \
  --set esMaster.storage.storageClass=do-block-storage \
  --set esData.storage.storageClass=do-block-storage
...
NAME: elasticsearch
LAST DEPLOYED: Mon Jun  6 15:06:45 2022
NAMESPACE:     ot-operators
STATUS:        deployed
REVISION:      1
TEST SUITE:    None
NOTES:
  CHART NAME:    elasticsearch
  CHART VERSION: 0.3.1
  APP VERSION:   0.3.0

The helm chart for Elasticsearch setup has been deployed.

Get the list of pods by executing:
    kubectl get pods --namespace ot-operators -l 'role in (master,data,ingestion,client)'

For getting the credential for admin user:
    kubectl get secrets -n ot-operators elasticsearch-password -o jsonpath="{.data.password}" | base64 -d
Verify the pod status and secret value by using:-
# Verify the status of the pods
$ kubectl get pods --namespace ot-operators -l 'role in (master,data,ingestion,client)'
...
NAME                     READY   STATUS    RESTARTS   AGE
elasticsearch-data-0     1/1     Running   0          77s
elasticsearch-data-1     1/1     Running   0          77s
elasticsearch-data-2     1/1     Running   0          77s
elasticsearch-master-0   1/1     Running   0          77s
elasticsearch-master-1   1/1     Running   0          77s
elasticsearch-master-2   1/1     Running   0          77s
# Verify the secret value
$ kubectl get secrets -n ot-operators elasticsearch-password -o jsonpath="{.data.password}" | base64 -d
...
EuDyr4A105EjqaNW
Elasticsearch cluster can be listed and verify using kubectl cli as well.
$ kubectl get elasticsearch -n ot-operators
...
NAME            VERSION   STATE   SHARDS   INDICES
elasticsearch   7.17.0    green   2        2
Setup by Kubectl (Kubernetes CLI)
It is not a recommended way for setting for Elasticsearch cluster, it can be used for the POC and learning of Logging operator deployment.
All the kubectl related manifest are located inside the example folder which can be applied using kubectl apply -f.
For an example:-
$ kubectl apply -f examples/elasticsearch/basic-cluster/basic-elastic.yaml -n ot-operators
...
elasticsearch/elasticsearch is created
Validation of Elasticsearch
To validate the state of Elasticsearch cluster, we can take the shell access of the Elasticsearch pod and verify elasticsearch version and details using curl command.
# Verify endpoint of elasticsearch
$ export ELASTIC_PASSWORD=$(kubectl get secrets -n ot-operators \
  elasticsearch-password -o jsonpath="{.data.password}" | base64 -d)

$ kubectl exec -it elasticsearch-master-0 -c elastic -n ot-operators \
  -- curl -u elastic:$ELASTIC_PASSWORD -k https://localhost:9200
...
{
  "name" : "elasticsearch-master-0",
  "cluster_name" : "elastic-prod",
  "cluster_uuid" : "vPtAZQt9SEWsl8NSfNVYzw",
  "version" : {
    "number" : "7.17.0",
    "build_flavor" : "default",
    "build_type" : "docker",
    "build_hash" : "bee86328705acaa9a6daede7140defd4d9ec56bd",
    "build_date" : "2022-01-28T08:36:04.875279988Z",
    "build_snapshot" : false,
    "lucene_version" : "8.11.1",
    "minimum_wire_compatibility_version" : "6.8.0",
    "minimum_index_compatibility_version" : "6.0.0-beta1"
  },
  "tagline" : "You Know, for Search"
}
Node status and health
Once the version details are verified we can list down the nodes connected to elasticsearch cluster and their health status. Also, we can verify the status health of complete elasticsearch cluster.
# Cluster health of elasticsearch cluster
$ kubectl exec -it elasticsearch-master-0 -c elastic -n ot-operators \
  -- curl -u elastic:$ELASTIC_PASSWORD -k https://localhost:9200/_cluster/health
...
{
  "cluster_name": "elastic-prod",
  "status": "green",
  "timed_out": false,
  "number_of_nodes": 6,
  "number_of_data_nodes": 3,
  "active_primary_shards": 1,
  "active_shards": 2,
  "relocating_shards": 0,
  "initializing_shards": 0,
  "unassigned_shards": 0,
  "delayed_unassigned_shards": 0,
  "number_of_pending_tasks": 0,
  "number_of_in_flight_fetch": 0,
  "task_max_waiting_in_queue_millis": 0,
  "active_shards_percent_as_number": 100
}
# Node status of elasticsearch
$ kubectl exec -it elasticsearch-master-0 -c elastic -n ot-operators \
  -- curl -u elastic:$ELASTIC_PASSWORD -k https://localhost:9200/_cat/nodes
...
ip           heap.percent ram.percent cpu load_1m load_5m load_15m node.role master name
10.244.1.69            54          19   0    0.00    0.00     0.01 m         -      elasticsearch-master-2
10.244.0.82            43          20   0    0.00    0.00     0.00 d         -      elasticsearch-data-2
10.244.0.150           28          19   0    0.00    0.12     0.12 d         -      elasticsearch-data-1
10.244.0.13            57          19   1    0.00    0.00     0.00 m         -      elasticsearch-master-0
10.244.1.72            13          20   0    0.00    0.00     0.01 d         -      elasticsearch-data-0
10.244.0.161           61          20   2    0.00    0.12     0.12 m         *      elasticsearch-master-1
2.3 - Fluentd Setup
Fluentd setup and management using logging operator
The operator is capable for setting up fluentd as a log shipper to trace, collect and ship logs to elasticsearch cluster. There are few additional functionalities added to this CRD.
- Namespace and application name based indexes
- Custom and additional configuration support
- TLS and auth support for authentication

Setup using Helm (Deployment Tool)
Add the helm repository, so that Fluentd chart can be available for the installation. The repository can be added by:-
# Adding helm repository
$ helm repo add ot-helm https://ot-container-kit.github.io/helm-charts/
...
"ot-helm" has been added to your repositories
If the repository is added make sure you have updated it with the latest information.
# Updating ot-helm repository
$ helm repo update
Once all these things have completed, we can install Fluentd cluster by using:-
# Install the helm chart of Fluentd
$ helm install fluentd ot-helm/fluentd --namespace ot-operators
...
NAME:          fluentd
LAST DEPLOYED: Mon Jun  6 19:37:11 2022
NAMESPACE:     ot-operators
STATUS:        deployed
REVISION:      1
TEST SUITE:    None
NOTES:
  CHART NAME:    fluentd
  CHART VERSION: 0.3.0
  APP VERSION:   0.3.0

The helm chart for Fluentd setup has been deployed.

Get the list of pods by executing:
    kubectl get pods --namespace ot-operators -l 'app=fluentd'

For getting the credential for admin user:
    kubectl get fluentd fluentd -n ot-operators
Verify the pod status and secret value by using:-
# Verify the status of the pods
$ kubectl get pods --namespace ot-operators -l 'app=fluentd'
...
NAME            READY   STATUS    RESTARTS   AGE
fluentd-7w48q   1/1     Running   0          3m9s
fluentd-dgcwx   1/1     Running   0          3m9s
fluentd-kq52c   1/1     Running   0          3m9s
Fluentd daemonset can be listed and verify using kubectl cli as well.
$ kubectl get fluentd -n ot-operators
...
NAME      ELASTICSEARCH HOST     TOTAL AGENTS
fluentd   elasticsearch-master   3
Setup by Kubectl (Kubernetes CLI)
It is not a recommended way for setting for Fluentd, it can be used for the POC and learning of Logging operator deployment.
All the kubectl related manifest are located inside the example folder which can be applied using kubectl apply -f.
For an example:-
$ kubectl apply -f examples/fluentd/basic/fluentd.yaml -n ot-operators
...
fluentd/fluentd is created
Validation of Fluentd
To validate the state of Fluentd, we can verify the log status of fluentd pods managed by daemonset.
# Validation of fluentd logs
$ kubectl logs fluentd-7w48q -n ot-operators
...
2022-06-06 14:07:28 +0000 [info]: #0 [in_tail_container_logs] following tail of /var/log/containers/fluentd-7w48q_ot-operators_fluentd-f49b48f7f447d05139819861b8b17c30e2bf2de094e25e23d1e9c5a274fd3d7e.log
2022-06-06 14:07:28 +0000 [info]: #0 fluentd worker is now running worker=0
2022-06-06 14:07:54 +0000 [info]: #0 [filter_kube_metadata] stats - namespace_cache_size: 5, pod_cache_size: 32, namespace_cache_api_updates: 16, pod_cache_api_updates: 16, id_cache_miss: 16, pod_cache_host_updates: 32, namespace_cache_host_updates: 5
Also, we can list down the indices using the curl command from the elasticsearch pod/container. If indices are available inside the elasticsearch that means fluentd is shipping the logs to elasticsearch without any issues.
$ export ELASTIC_PASSWORD=$(kubectl get secrets -n ot-operators \
  elasticsearch-password -o jsonpath="{.data.password}" | base64 -d)

$ kubectl exec -it elasticsearch-master-0 -c elastic -n ot-operators \
  -- curl -u elastic:$ELASTIC_PASSWORD -k "https://localhost:9200/_cat/indices?v"
...
health status index                              uuid                   pri rep docs.count docs.deleted store.size pri.store.size
green  open   .geoip_databases                   _GEkcekFSr2KY1Z4jFmWRQ   1   1         40            0     76.4mb         38.2mb
green  open   kubernetes-ot-operators-2022.06.06 QlS_dyjzQ8qIXQi2PgpABA   1   1      20665            0      7.9mb          3.9mb
green  open   kubernetes-kube-system-2022.06.06  vWQ5IzoHQWW9zl8bQk0jlw   1   1      12006            0        7mb          4.3mb
2.4 - Kibana Setup
Kibana setup and management using logging operator
The operator is capable for setting up Kibana as a visualization and dashboard tool for elasticsearch cluster. There are few additional functionalities added to this CRD.
Setup using Helm (Deployment Tool)
Add the helm repository, so that Kibana chart can be available for the installation. The repository can be added by:-
# Adding helm repository
$ helm repo add ot-helm https://ot-container-kit.github.io/helm-charts/
...
"ot-helm" has been added to your repositories
If the repository is added make sure you have updated it with the latest information.
# Updating ot-helm repository
$ helm repo update
Once all these things have completed, we can install Kibana cluster by using:-
# Install the helm chart of Kibana
$ helm upgrade kibana ot-helm/kibana --install --namespace ot-operators
...
NAME: kibana
LAST DEPLOYED: Sat Aug  6 23:51:28 2022
NAMESPACE: ot-operators
STATUS: deployed
REVISION: 1
TEST SUITE: None
NOTES:
  CHART NAME: kibana
  CHART VERSION: 0.3.2
  APP VERSION: 0.3.0

The helm chart for Kibana setup has been deployed.

Get the list of pods by executing:
    kubectl get pods --namespace ot-operators -l 'app=kibana'

For getting the credential for admin user:
    kubectl get kibana kibana -n ot-operators
Verify the pod status value by using:-
# Verify the status of the pods
$ kubectl get pods --namespace ot-operators -l 'app=kibana'
...
NAME                      READY   STATUS    RESTARTS   AGE
kibana-7b649df777-nkr2p   1/1     Running   0          3m27s
Kibana deployment can be listed and verify using kubectl cli as well.
$ kubectl get kibana -n ot-operators
NAME     VERSION   ES CLUSTER
kibana   7.17.0    elasticsearch
Setup by Kubectl (Kubernetes CLI)
It is not a recommended way for setting for Kibana, it can be used for the POC and learning of Logging operator deployment.
All the kubectl related manifest are located inside the example folder which can be applied using kubectl apply -f.
For an example:-
$ kubectl apply -f examples/kibana/basic/kibana.yaml -n ot-operators
...
kibana.logging.logging.opstreelabs.in/kibana is created
Validation of Kibana
To validate the state of Kibana, we can verify the log status of kibana pods managed by deployment.
# Validation of kibana logs
$ kubectl logs kibana-7bc5cd8747-pgtzc -n ot-operators
...
{"type":"log","@timestamp":"2022-08-06T18:22:04+00:00","tags":["info","plugins-service"],"pid":8,"message":"Plugin \"metricsEntities\" is disabled."}
{"type":"log","@timestamp":"2022-08-06T18:22:04+00:00","tags":["info","http","server","Preboot"],"pid":8,"message":"http server running at http://0.0.0.0:5601"}
{"type":"log","@timestamp":"2022-08-06T18:22:04+00:00","tags":["warning","config","deprecation"],"pid":8,"message":"Starting in 8.0, the Kibana logging format will be changing. This may affect you if you are doing any special handling of your Kibana logs, such as ingesting logs into Elasticsearch for further analysis. If you are using the new logging configuration, you are already receiving logs in both old and new formats, and the old format will simply be going away. If you are not yet using the new logging configuration, the log format will change upon upgrade to 8.0. Beginning in 8.0, the format of JSON logs will be ECS-compatible JSON, and the default pattern log format will be configurable with our new logging system. Please refer to the documentation for more information about the new logging format."}
Also, the UI can be accessed on 5601 port for validation.

3 - Configuration
Configuration parameters/options for CRD and Helm Charts
3.1 - Elasticsearch Config
Elasticsearch configuration paramaters with respect to logging operator
Elasticsearch configuration is easily customizable using helm as well kubectl. Since all the configurations are in the form YAML file, it can be easily changed and customized.
The values.yaml file for Elasticsearch setup can be found here. But if the setup is not done using Helm, in that case Kubernetes manifests needs to be customized.
Helm Chart Parameters
| Name | Value | Description |
|---|---|---|
| clusterName | elastic-prod | Name of the elasticsearch cluster |
| esVersion | 7.17.0 | Major and minor version of elaticsearch |
| esPlugins | [] | Plugins list to install inside elasticsearch |
| esKeystoreSecret | - | Keystore secret to include in elasticsearch cluster |
| customConfiguration | {} | Additional configuration parameters for elasticsearch |
| esSecurity.enabled | true | To enabled the xpack security of elasticsearch |
| esMaster.replicas | 3 | Number of replicas for elasticsearch master node |
| esMaster.storage.storageSize | 20Gi | Size of the elasticsearch persistent volume for master |
| esMaster.storage.accessModes | [ReadWriteOnce] | Access modes of the elasticsearch persistent volume for master |
| esMaster.storage.storageClass | default | Storage class of the elasticsearch persistent volume for master |
| esMaster.jvmMaxMemory | 1Gi | Java max memory for elasticsearch master node |
| esMaster.jvmMinMemory | 1Gi | Java min memory for elasticsearch master node |
| esMaster.resources | {} | Resources for elasticsearch master pods |
| esMaster.nodeSelectors | {} | Nodeselectors map key-values for elasticsearch master pods |
| esMaster.affinity | {} | Affinity and anit-affinity for elasticsearch master pods |
| esMaster.tolerations | {} | Tolerations and taints for elasticsearch master pods |
| esData.replicas | 3 | Number of replicas for elasticsearch data node |
| esData.storage.storageSize | 50Gi | Size of the elasticsearch persistent volume for data |
| esData.storage.accessModes | [ReadWriteOnce] | Access modes of the elasticsearch persistent volume for data |
| esData.storage.storageClass | default | Storage class of the elasticsearch persistent volume for data |
| esData.jvmMaxMemory | 1Gi | Java max memory for elasticsearch data node |
| esData.jvmMinMemory | 1Gi | Java min memory for elasticsearch data node |
| esData.resources | {} | Resources for elasticsearch data pods |
| esData.nodeSelectors | {} | Nodeselectors map key-values for elasticsearch data pods |
| esData.affinity | {} | Affinity and anit-affinity for elasticsearch data pods |
| esData.tolerations | {} | Tolerations and taints for elasticsearch data pods |
| esIngestion.replicas | - | Number of replicas for elasticsearch ingestion node |
| esIngestion.storage.storageSize | - | Size of the elasticsearch persistent volume for ingestion |
| esIngestion.storage.accessModes | - | Access modes of the elasticsearch persistent volume for ingestion |
| esIngestion.storage.storageClass | - | Storage class of the elasticsearch persistent volume for ingestion |
| esIngestion.jvmMaxMemory | - | Java max memory for elasticsearch ingestion node |
| esIngestion.jvmMinMemory | - | Java min memory for elasticsearch ingestion node |
| esIngestion.resources | - | Resources for elasticsearch ingestion pods |
| esIngestion.nodeSelectors | - | Nodeselectors map key-values for elasticsearch ingestion pods |
| esIngestion.affinity | - | Affinity and anit-affinity for elasticsearch ingestion pods |
| esIngestion.tolerations | - | Tolerations and taints for elasticsearch ingestion pods |
| esClient.replicas | - | Number of replicas for elasticsearch ingestion node |
| esClient.storage.storageSize | - | Size of the elasticsearch persistent volume for client |
| esClient.storage.accessModes | - | Access modes of the elasticsearch persistent volume for client |
| esClient.storage.storageClass | - | Storage class of the elasticsearch persistent volume for client |
| esClient.jvmMaxMemory | - | Java max memory for elasticsearch client node |
| esClient.jvmMinMemory | - | Java min memory for elasticsearch client node |
| esClient.resources | - | Resources for elasticsearch client pods |
| esClient.nodeSelectors | - | Nodeselectors map key-values for elasticsearch client pods |
| esClient.affinity | - | Affinity and anit-affinity for elasticsearch client pods |
| esClient.tolerations | - | Tolerations and taints for elasticsearch client pods |
CRD Object Definition Parameters
These are the parameters that are currently supported by the Logging Operator for the Elastisearch setup:-
- esClusterName
- esVersion
- esMaster
- esData
- esIngestion
- esClient
- esSecurity
- customConfig
esClusterName
esClusterName is a parameter to define the name of elasticsearch cluster.
esClusterName: "prod"
esVersion
esVersion is a CRD option through which we can define the version of elasticsearch.
esVersion: "7.16.0"
esPlugins
esPlugins is a CRD parameter through which we can define the list of plugins that needs to install inside elasticsearch cluster.
esPlugins: ["respository-s3", "repository-gcs"]
esKeystoreSecret
esKeystoreSecret is a CRD parameter through which we can define the keystore related secret to include in elasticsearch cluster.
esKeystoreSecret: keystore-secret
esMaster
esMaster is a general configuration parameter for Elasticsearch CRD for defining the configuration of Elasticsearch Master node. This includes Kubernetes related configurations and Elasticsearch properties related configurations.
  esMaster:
    replicas: 2
    storage:
      storageSize: 2Gi
      accessModes: [ReadWriteOnce]
      storageClass: do-block-storage
    jvmMaxMemory: "512m"
    jvmMinMemory: "512m"
    kubernetesConfig:
      elasticAffinity:
        nodeAffinity:
          requiredDuringSchedulingIgnoredDuringExecution:
            nodeSelectorTerms:
              - matchExpressions:
                  - key: beta.kubernetes.io/os
                    operator: In
                    values:
                      - linux
      nodeSelectors:
        kubernetes.io/os: linux
      priorityClassName: system-node-critical
      resources:
        requests:
          cpu: 101m
          memory: 512Mi
        limits:
          cpu: 2000m
          memory: 2Gi
      tolerations:
        - key: "example-key"
          operator: "Exists"
          effect: "NoSchedule"
Note:- All properties defined under kubernetesConfig can be used for other elasticsearch node types as well.
esData
esData is a general configuration parameter for Elasticsearch CRD for defining the configuration of Elasticsearch Data node. This includes Kubernetes related configurations and Elasticsearch properties related configurations.
  esData:
    replicas: 2
    storage:
      storageSize: 2Gi
      accessModes: [ReadWriteOnce]
      storageClass: do-block-storage
    jvmMaxMemory: "512m"
    jvmMinMemory: "512m"
esIngestion
esIngestion is a general configuration parameter for Elasticsearch CRD for defining the configuration of Elasticsearch Ingestion node. This includes Kubernetes related configurations and Elasticsearch properties related configurations.
  esIngestion:
    replicas: 2
    storage:
      storageSize: 2Gi
      accessModes: [ReadWriteOnce]
      storageClass: do-block-storage
    jvmMaxMemory: "512m"
    jvmMinMemory: "512m"
esClient
esClient is a general configuration parameter for Elasticsearch CRD for defining the configuration of Elasticsearch Client node. This includes Kubernetes related configurations and Elasticsearch properties related configurations.
  esClient:
    replicas: 2
    storage:
      storageSize: 2Gi
      accessModes: [ReadWriteOnce]
      storageClass: do-block-storage
    jvmMaxMemory: "512m"
    jvmMinMemory: "512m"
esSecurity
esSecurity s the security specification for Elasticsearch CRD. If we want to enable authentication and TLS, in that case, we can enable this configuration. To enable the authentication we need to provide secret reference in Kubernetes.
  esSecurity:
    autoGeneratePassword: true
    tlsEnabled: true
#   existingSecret: elastic-custom-password
customConfig
customConfig is a Elasticsearch config file parameter through which we can provide custom configuration to elasticsearch nodes. This property is applicable for all types of nodes in elasticsearch.
  esMaster:
    replicas: 3
    storage:
      storageSize: 2Gi
      accessModes: [ReadWriteOnce]
      storageClass: do-block-storage
    customConfig: elastic-additional-config
3.2 - Fluentd Config
Elasticsearch configuration paramaters with respect to logging operator
Fluentd configuration is easily customizable using helm as well kubectl. Since all the configurations are in the form YAML file, it can be easily changed and customized.
The values.yaml file for Fluentd setup can be found here. But if the setup is not done using Helm, in that case Kubernetes manifests needs to be customized.
Helm chart parameters
| Name | Values | Description |
|---|---|---|
| elasticSearchHost | elasticsearch-master | Hostname or URL of the elasticsearch server |
| indexNameStrategy | namespace_name | Strategy for creating indexes like:- namespace_name or pod_name |
| resources | {} | Resources for fluentd daemonset pods |
| nodeSelectors | {} | Nodeselectors map key-values for fluentd daemonset pods |
| affinity | {} | Affinity and anit-affinity for fluentd daemonset pods |
| tolerations | {} | Tolerations and taints for fluentd daemonset pods |
| customConfiguration | {} | Custom configuration parameters for fluentd |
| additionalConfiguration | {} | Additional configuration parameters for fluentd |
| esSecurity.enabled | true | To enabled the xpack security of fluentd |
| esSecurity.elasticSearchPassword | elasticsearch-password | Credentials for elasticsearch authentication |
CRD object definition parameters
These are the parameters that are currently supported by the Logging Operator for the Fluentd setup:-
- esCluster
- indexNameStrategy
- esSecurity
- customConfig
- additionalConfig
- kubernetesConfig
esCluster
esCluster is a general parameter of Fluentd CRD for providing the information about Elasticsearch nodes.
  esCluster:
    host: elasticsearch-master
indexNameStrategy
indexNameStrategy naming standard for the indexes created inside the Elasticsearch cluster, It could be based on namespace like kubernetes-marketing-2022-07-04 or based on application/pod name kubernetes-gateway-application-2022-07-04.
indexNameStrategy: namespace_name
esSecurity
esSecurity s the security specification for Fluentd CRD. If we want to enable authentication and TLS, in that case, we can enable this configuration. To enable the authentication we need to provide secret reference in Kubernetes.
  esSecurity:
    tlsEnabled: true
    existingSecret: elasticsearch-password
customConfig
customConfig is a field of Fluentd definition through which existing configuration of Fluentd can be overwritten, but be cautious while making this change because it can break the Fluentd.
customConfig: fluentd-custom-config
additionalConfig
additionalConfig is a field of Fluentd definition through which additional configuration can be mounted inside the Fluentd log-shipper. Additional configmap will be part of fluentd configuration.
additionalConfig: fluentd-additional-config
kubernetesConfig
kubernetesConfig is the general configuration paramater for Fluentd CRD in which we are defining the Kubernetes related configuration details like- image, tag, imagePullPolicy, and resources.
  kubernetesConfig:
    resources:
      requests:
        cpu: 100m
        memory: 100Mi
      limits:
        cpu: 2000m
        memory: 2Gi
3.3 - Kibana Config
Kibana configuration paramaters with respect to logging operator
Kibana configuration is easily customizable using helm as well kubectl. Since all the configurations are in the form YAML file, it can be easily changed and customized.
The values.yaml file for Kibana setup can be found here. But if the setup is not done using Helm, in that case Kubernetes manifests needs to be customized.
Helm chart parameters
| Name | Value | Description |
|---|---|---|
| replicas | 1 | Number of deployment replicas for kibana |
| esCluster.esURL | https://elasticsearch-master:9200 | Hostname or URL of the elasticsearch server |
| esCluster.esVersion | 7.17.0 | Version of the kibana in pair with elasticsearch |
| esCluster.clusterName | elasticsearch | Name of the elasticsearch created by elasticsearch crd |
| resources | {} | Resources for kibana visualization pods |
| nodeSelectors | {} | Nodeselectors map key-values for kibana visualization pods |
| affinity | {} | Affinity and anit-affinity for kibana visualization pods |
| tolerations | {} | Tolerations and taints for kibana visualization pods |
| esSecurity.enabled | true | To enabled the xpack security of kibana |
| esSecurity.elasticSearchPassword | elasticsearch-password | Credentials for elasticsearch authentication |
| externalService.enabled | false | To create a LoadBalancer service of kibana |
| ingress.enabled | false | To enable the ingress resource for kibana |
| ingress.host | kibana.opstree.com | Hostname or URL on which kibana will be exposed |
| ingress.tls.enabled | false | To enable SSL on kibana ingress resource |
| ingress.tls.secret | tls-secret | SSL certificate for kibana ingress resource |
CRD object definition parameters
These are the parameters that are currently supported by the Logging Operator for the Kibana setup:-
- replicas
- esCluster
- esSecurity
- kubernetesConfig
replicas
replicas is field definition of Kibana CRD in which we can define how many replicas/instances of Kibana we would like to run. Similar field like replicas in deployment and replicasets.
replicas: 1
esCluster
esCluster is a general parameter of Fluentd CRD for providing the information about Elasticsearch nodes.
  esCluster:
    host: https://elasticsearch-master:9200
    esVersion: 7.16.0
    clusterName: elasticsearch
esSecurity
esSecurity s the security specification for Fluentd CRD. If we want to enable authentication and TLS, in that case, we can enable this configuration. To enable the authentication we need to provide secret reference in Kubernetes.
  esSecurity:
    tlsEnabled: true
    existingSecret: elasticsearch-password
kubernetesConfig
kubernetesConfig is the general configuration paramater for Fluentd CRD in which we are defining the Kubernetes related configuration details like- image, tag, imagePullPolicy, and resources.
  kubernetesConfig:
    resources:
      requests:
        cpu: 100m
        memory: 100Mi
      limits:
        cpu: 2000m
        memory: 2Gi
4 - Advance Configuration
Advance configuration information for Logging Operator
4.1 - Elasticsearch
Advance configuration information for Elasticsearch
4.1.1 - Plugins Management
Plugins related configuration for elasticsearch
Plugins Installation
Plugins installation has been simplified using the Logging Operator. To install the plugins inside the elasticsearch, we just need to define the list of plugins inside the esPlugins section of elasticsearch CRD.
For example:-
---
apiVersion: logging.logging.opstreelabs.in/v1beta1
kind: Elasticsearch
metadata:
  name: elasticsearch
spec:
  esClusterName: "prod"
  esVersion: "7.16.0"
  esPlugins: ["repository-s3"]
Validation of plugin installation can be done using elasticsearch-plugin or curl command.
$ kubectl exec -it elasticsearch-master-0 -n ot-operators -- ./bin/elasticsearch-plugin list
...
repository-s3
$ kubectl exec -it elasticsearch-master-0 -n ot-operators -- curl http://localhost:9200/_cat/plugins
...
elasticsearch-master-1 repository-s3 7.16.0
elasticsearch-master-2 repository-s3 7.16.0
elasticsearch-master-0 repository-s3 7.16.0
Helm Configuration
Plugin installation can also be done using helm chart of elasticsearch. We just need to define the plugins list in the values file of elasticsearch helm chart.
https://github.com/OT-CONTAINER-KIT/helm-charts/blob/main/charts/elasticsearch/values.yaml#L8
$ helm upgrade elasticsearch ot-helm/elasticsearch --namespace ot-operators \
  --set esMaster.storage.storageClass=do-block-storage \
  --set esData.storage.storageClass=do-block-storage --install
4.1.2 - Keystore Integration
Keystore integration configuration for elasticsearch
Keystore integation
Keystore is a recommended way of integrating different credentials like:- AWS, GCP, Azure and Slack, etc. to elasticsearch cluster. We simply need to create a Kubernetes secret and the operator can take care the integration of Kubernetes secret to elasticsearch keystore.
$ kubectl create secret generic slack-hook \
--from-literal=xpack.notification.slack.account.monitoring.secure_url='https://hooks.slack.com/services/asdasdasd/asda'
or yaml file is also one of the way for creating the secret.
---
apiVersion: v1
kind: Secret
metadata:
  name: encryption-key
data:
  xpack.notification.slack.account.monitoring.secure_url: aHR0cHM6Ly9ob29rcy5zbGFjay5jb20vc2VydmljZXMvYXNkYXNkYXNkL2FzZGFzZGFzL2FzZGFzZA==
# other secrets key value pairs can be defined here
type: Opaque
Then simply we can define the keystore secret name in CRD definition.
---
apiVersion: logging.logging.opstreelabs.in/v1beta1
kind: Elasticsearch
metadata:
  name: elasticsearch
spec:
  esClusterName: "prod"
  esVersion: "7.16.0"
  esKeystoreSecret: encryption-key
Validation of keystore can be done using elasticsearch-keystore command.
$ kubectl exec -it elasticsearch-master-0 -n ot-operators -- ./bin/elasticsearch-keystore list
...
keystore.seed
xpack.notification.slack.account.monitoring.secure_url
Helm Configuration
Keystore integration can also be done using helm chart of elasticsearch. We just need to define the keystore secret name in the values file of elasticsearch helm chart.
https://github.com/OT-CONTAINER-KIT/helm-charts/blob/main/charts/elasticsearch/values.yaml#L9
$ helm upgrade elasticsearch ot-helm/elasticsearch --namespace ot-operators \
  --set esMaster.storage.storageClass=do-block-storage \
  --set esData.storage.storageClass=do-block-storage --install
5 - Development
Development related information for Logging Operator
5.1 - Development Guide
Development guide for Logging Operator
Pre-requisites
Access to Kubernetes cluster
First, you will need access to a Kubernetes cluster. The easiest way to start is minikube.
Tools to build an Operator
Apart from kubernetes cluster, there are some tools which are needed to build and test the Logging Operator.
Building Operator
To build the operator on local system, we can use make command.
$ make manager
...
go build -o bin/manager main.go
MongoDB operator gets packaged as a container image for running on the Kubernetes cluster.
$ make docker-build
...
[+] Building 124.8s (19/19) FINISHED
 => [internal] load build definition from Dockerfile                                                                                                                         0.1s
 => => transferring dockerfile: 866B                                                                                                                                         0.0s
 => [internal] load .dockerignore                                                                                                                                            0.1s
 => => transferring context: 171B                                                                                                                                            0.0s
 => [internal] load metadata for gcr.io/distroless/static:nonroot                                                                                                            1.6s
 => [internal] load metadata for docker.io/library/golang:1.17                                                                                                               0.0s
 => CACHED [stage-1 1/3] FROM gcr.io/distroless/static:nonroot@sha256:2556293984c5738fc75208cce52cf0a4762c709cf38e4bf8def65a61992da0ad                                       0.0s
 => [internal] load build context                                                                                                                                            0.1s
 => => transferring context: 265.64kB                                                                                                                                        0.1s
 => [builder  1/11] FROM docker.io/library/golang:1.17                                                                                                                       0.0s
 => CACHED [builder  2/11] WORKDIR /workspace                                                                                                                                0.0s
 => [builder  3/11] COPY go.mod go.mod                                                                                                                                       0.1s
 => [builder  4/11] COPY go.sum go.sum                                                                                                                                       0.1s
 => [builder  5/11] RUN go mod download                                                                                                                                     32.5s
 => [builder  6/11] COPY main.go main.go                                                                                                                                     0.0s
 => [builder  7/11] COPY api/ api/                                                                                                                                           0.0s
 => [builder  8/11] COPY controllers/ controllers/                                                                                                                           0.0s
 => [builder  9/11] COPY k8sgo/ k8sgo/                                                                                                                                       0.0s
 => [builder 10/11] COPY elasticgo/ elasticgo/                                                                                                                               0.0s
 => [builder 11/11] RUN CGO_ENABLED=0 GOOS=linux GOARCH=amd64 go build -a -o manager main.go                                                                                89.2s
 => [stage-1 2/3] COPY --from=builder /workspace/manager .                                                                                                                   0.2s
 => exporting to image                                                                                                                                                       0.3s
 => => exporting layers                                                                                                                                                      0.3s
 => => writing image sha256:0875d1dd92839e2722f50d9f6b0be6fbe60ac56f3e3aa13ecad3b1c6a5862330                                                                                 0.0s
 => => naming to quay.io/opstree/logging-operator:v0.3.1
If you want to play it on Kubernetes. You can use a minikube.
$ minikube start --vm-driver virtualbox
...
😄  minikube v1.0.1 on linux (amd64)
🤹  Downloading Kubernetes v1.14.1 images in the background ...
🔥  Creating kvm2 VM (CPUs=2, Memory=2048MB, Disk=20000MB) ...
📶  "minikube" IP address is 192.168.39.240
🐳  Configuring Docker as the container runtime ...
🐳  Version of container runtime is 18.06.3-ce
⌛  Waiting for image downloads to complete ...
✨  Preparing Kubernetes environment ...
🚜  Pulling images required by Kubernetes v1.14.1 ...
🚀  Launching Kubernetes v1.14.1 using kubeadm ...
⌛  Waiting for pods: apiserver proxy etcd scheduler controller dns
🔑  Configuring cluster permissions ...
🤔  Verifying component health .....
💗  kubectl is now configured to use "minikube"
🏄  Done! Thank you for using minikube!
$ make test
5.2 - Continous Integration Pipeline
Continous Integration Pipeline for Logging Operator
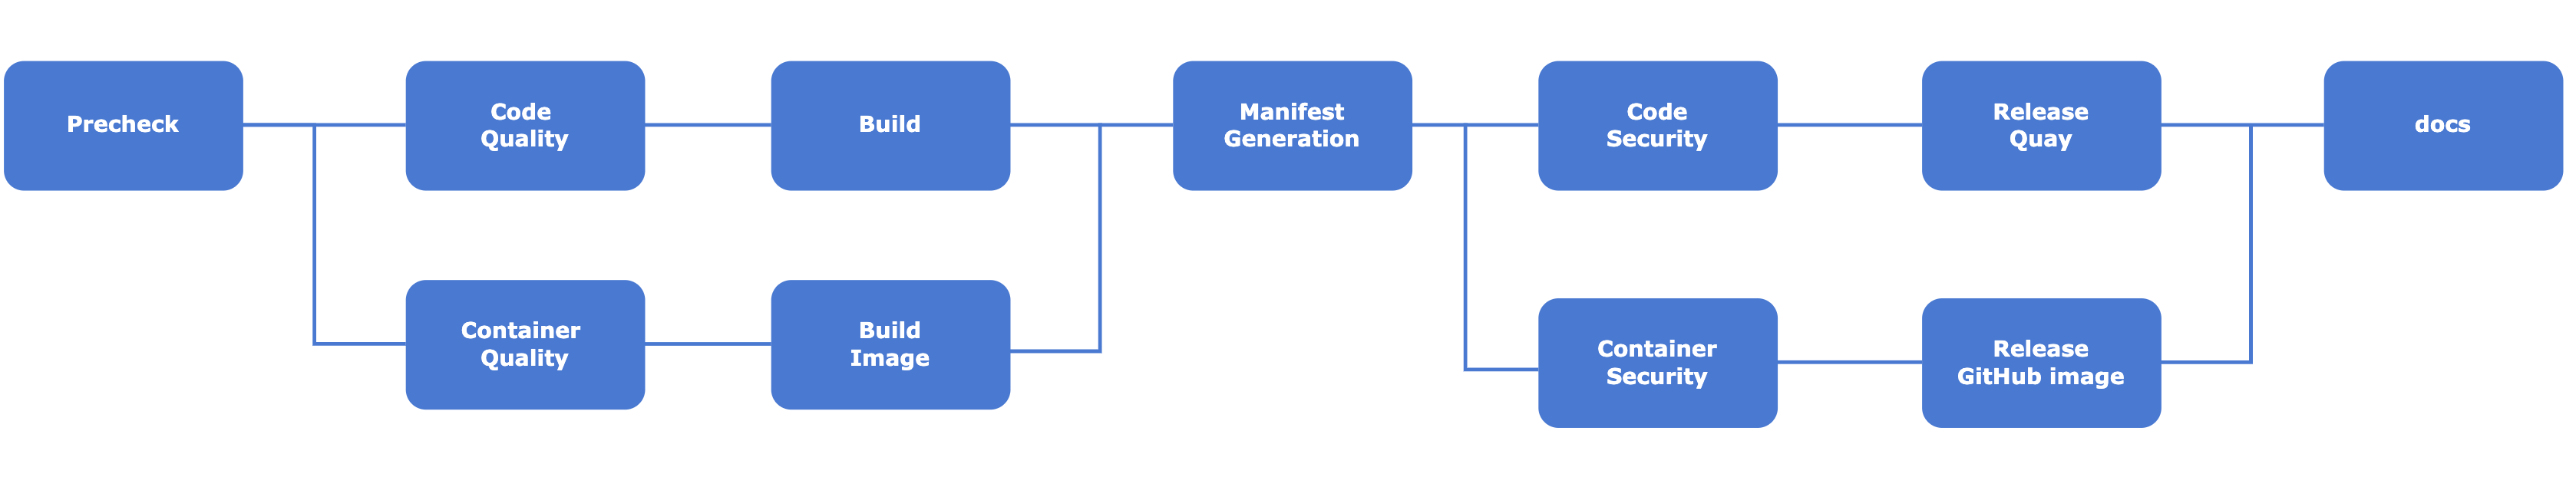
We are using Azure DevOps pipeline for the Continous Integration in the Logging Operator. It checks all the important checks for the corresponding Pull Request. Also, this pipeline is capable of making releases on Quay, Dockerhub, and GitHub.
The pipeline definition can be edited inside the .azure-pipelines.
Tools used for CI process:-
- Golang —> https://go.dev/
- Golang CI Lint —. https://github.com/golangci/golangci-lint
- Hadolint —> https://github.com/hadolint/hadolint
- GoSec —> https://github.com/securego/gosec
- Trivy —> https://github.com/aquasecurity/trivy

6 - Release History
Release history information for Logging Operator
6.1 - CHANGELOG
Changelog version history for Logging Operator
v0.4.0
September 3, 2022
🏄 Features
- Added elasticsearch 8.X version support
- Added plugin’s installation support in elasticsearch
- Added keystore integration in elasticsearch
v0.3.0
July 4, 2022
🏄 Features
- Revamped logging operator with better structure and examples
- Added security scanning of project
- Added code security information
- Added pipeline for Continous Integration
- Added detailed documentation for logging operator
v0.2.0
September 7, 2020
🏄 Features
- Fluentd custom configuration support
- Index Lifecycle policy support
- Index template support
- CRD Updates for better status insights
v0.1.0
August 20, 2020
🏄 Features
- Added elasticsearch TLS/non-TLS setup
- Customizable elasticsearch configuration and Heap size
- Fluentd as a log-shipper which already has JSON logs support
- Kibana integration with elasticsearch for logs visualization
- Seamless upgrade for Elasticsearch, Fluentd, and Kibana
- Loosely coupled setup, i.e. Elasticsearch, Fluentd, and Kibana can be setup individually as well